The strangest explanation of VLANs you've never heard
Mental models rarely fit neatly into little boxes, yet we try to visualize them using overly simplistic means. For once, let's get a little nutty.

Bear with me, this is going to be a weird one.
This is the first part in a series of odd explorations and exposition with the intent of providing a fresh take on the subjects of VLANs, subnets, cross-discipline topology, network protocols, and mental models by altering visualization techniques to make the concepts more approachable to the uninitiated and more engaging to experienced engineers.
You might have a good idea of what VLANs are, already. You might know them more thoroughly than I do. Or perhaps you've never even heard of them before. Whatever the case may be, I'm fairly certain you will have never come across an explanation of them remotely as weird as what I'm going to offer here.
I recently spent a decent amount of time deep diving on VLANs, and I got a bit frustrated with the explanations I came across. They did the job well enough. The explanations conveyed the concepts, but they felt incomplete. I had difficulty forming a mental representation of what was going on. And I noticed a disparity of information between the baseline explanations and the explanations that were so incredibly in-depth that they required hours of mulling over flow charts of hardware level packet handling in order to understand. There wasn't a whole lot in between.
I talked about this effect a bit more in another post, The Many Labyrinths Interpretation.
 Nad
Nad
In that, I suggested that offering the details of one's learning experience, though they may differ from others', can be a vital aspect of overcoming the disparity of information available in the void between superficial understanding and deeper comprehension. While a deeper comprehension of VLANs is beyond the scope of this strange little thought experiment, I hope to at least provide some context from my own experience in a way that would move that deeper comprehension within reach.
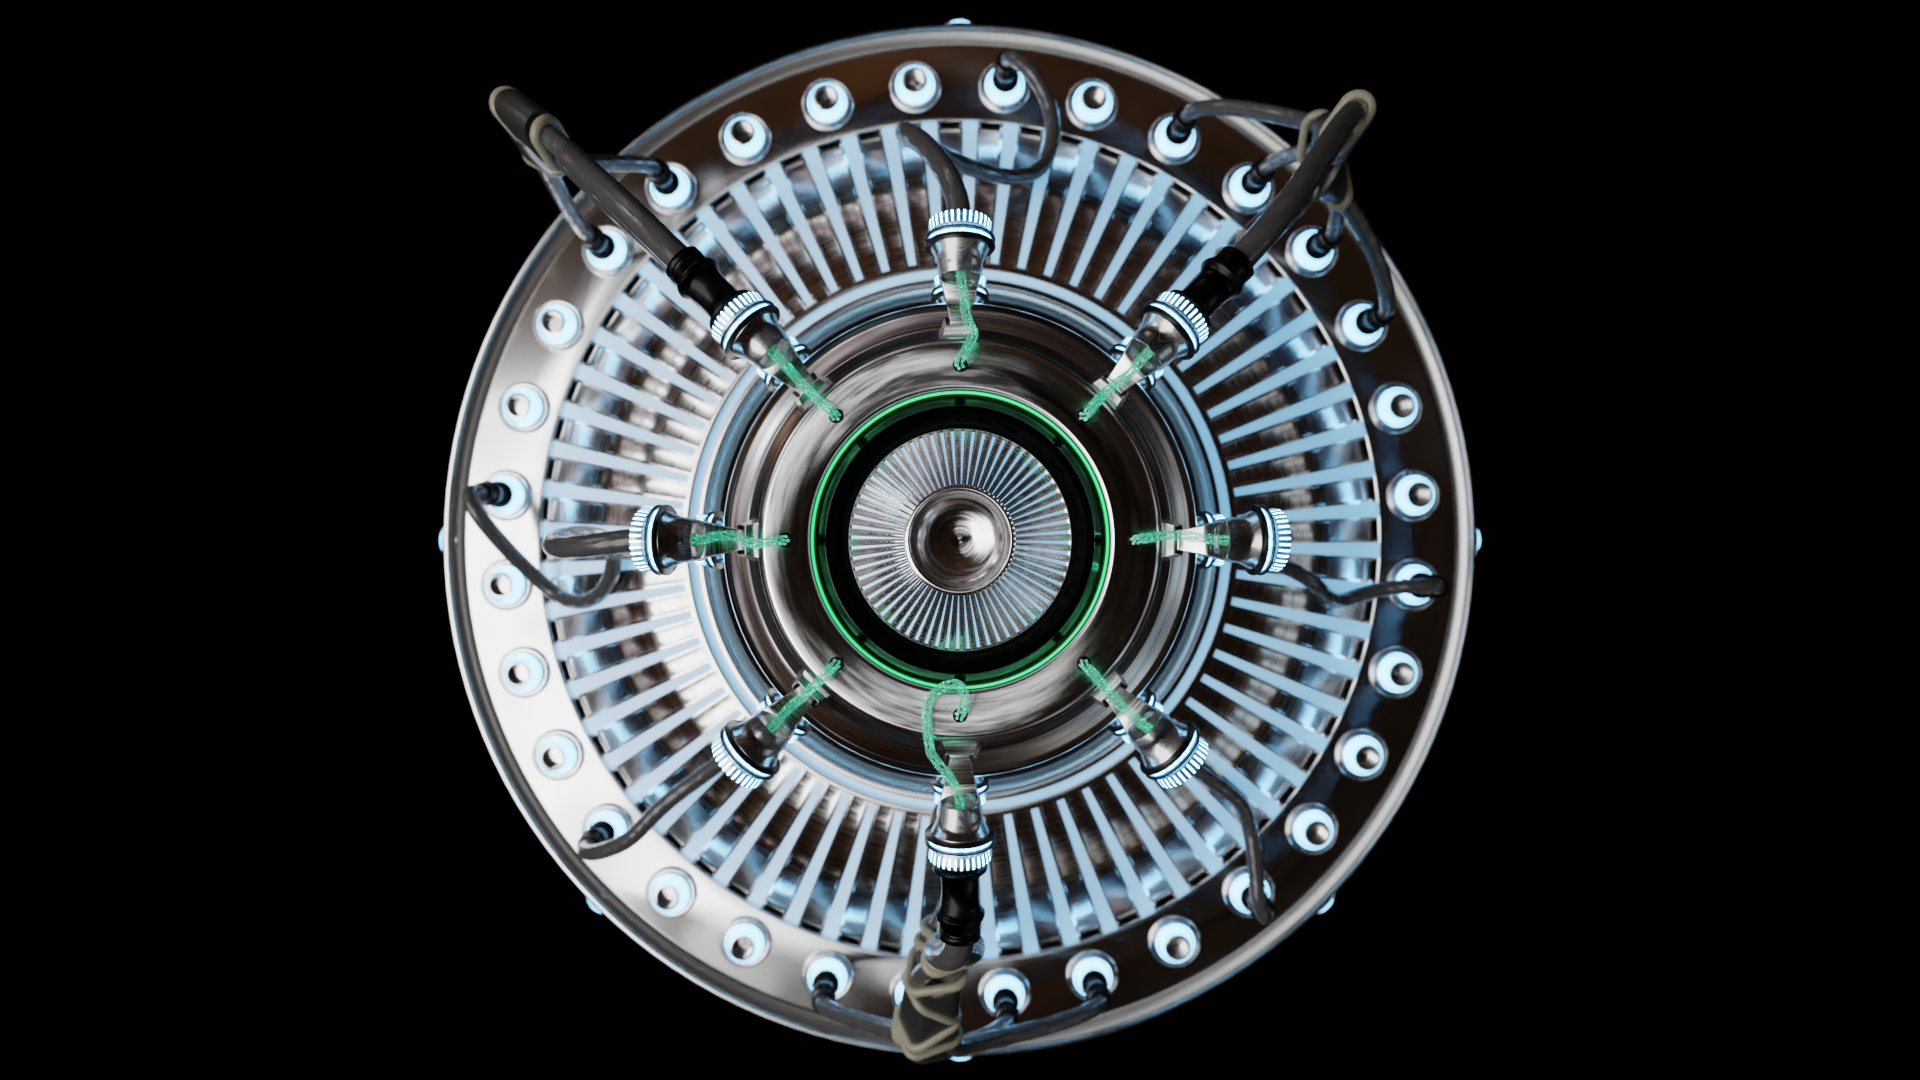
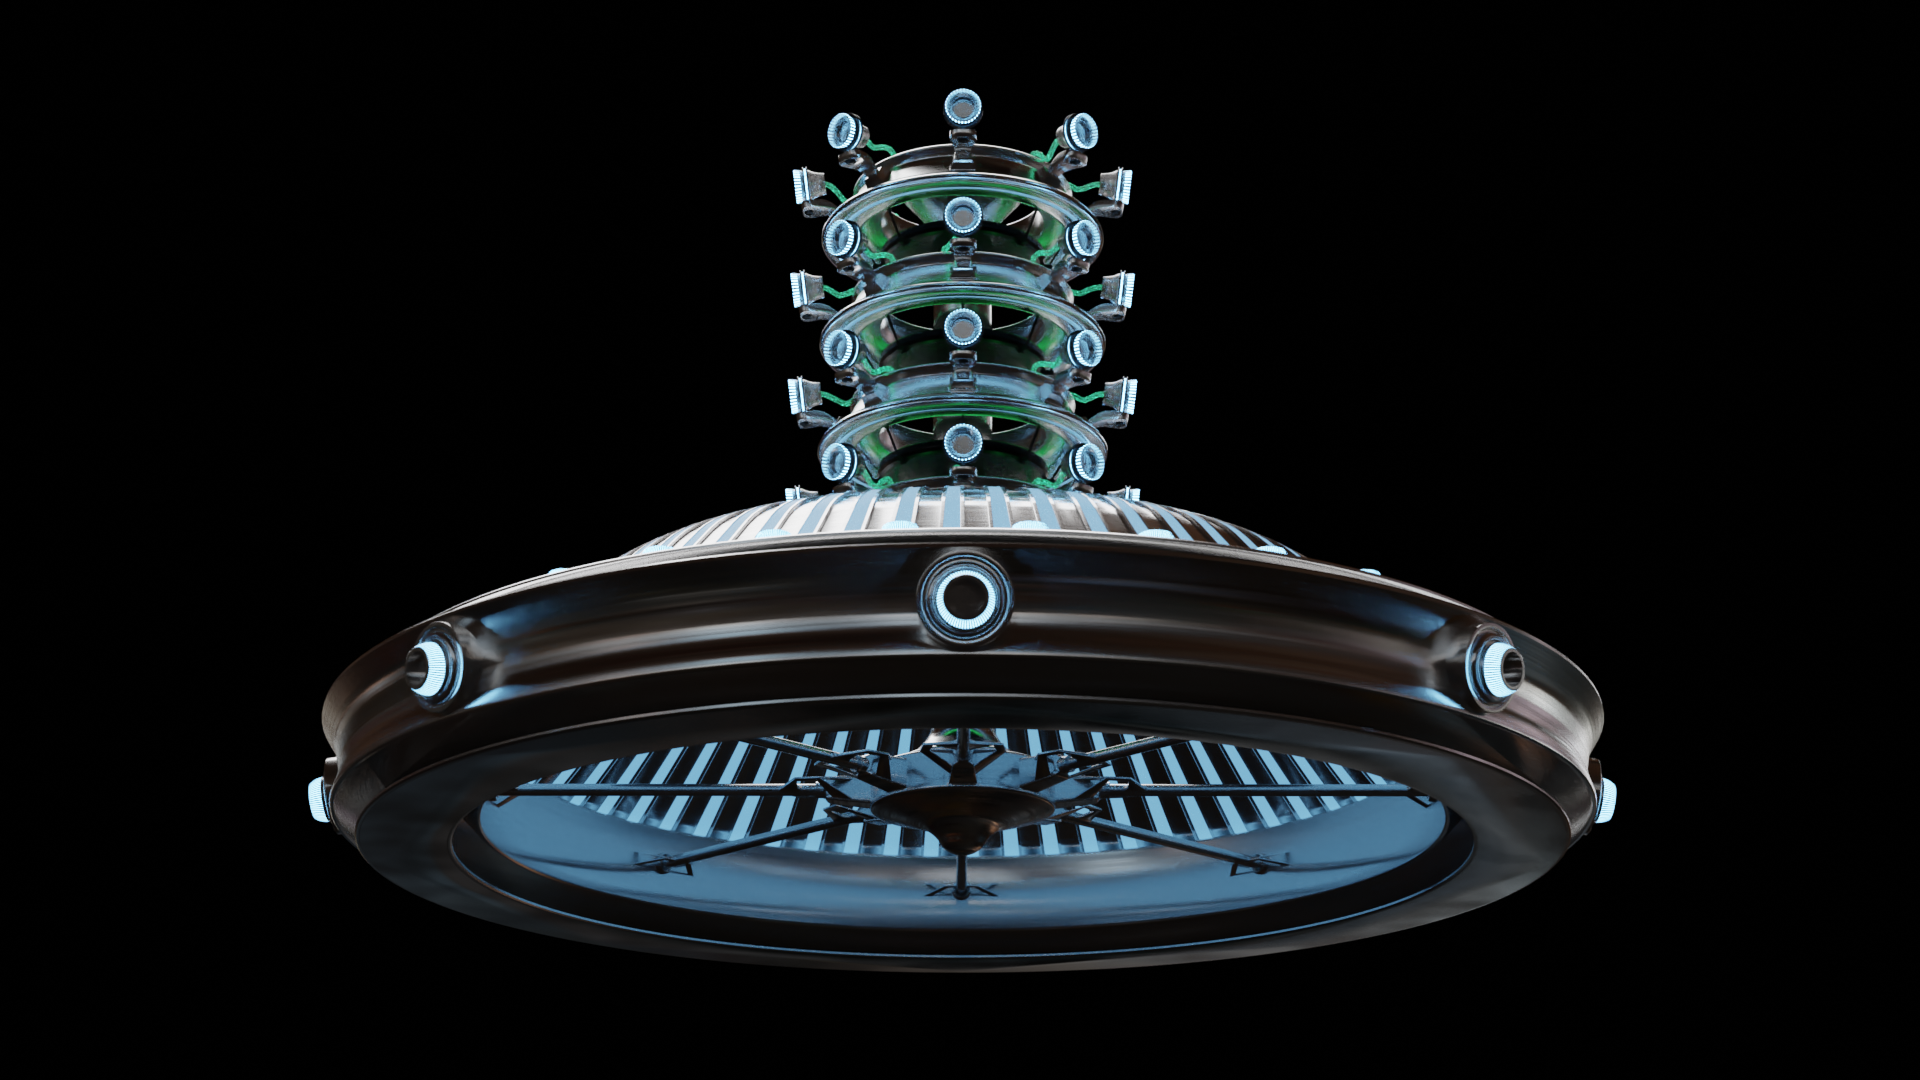
If you're new to VLANs and wondering what the heck is going on here, I will do my best to explain them as I understand them shortly. Before that though, I just want to lay some groundwork and provide some context as to why I would bother making a sci-fi rendering of a strange Battlestar-Galactica-lookin'-subwoofer-thing.
Diagrams and charts enable succinct visual representation of concepts, but they have inherent limitations. In simplifying complex ideas into straightforward representations, a degree of complexity is summarily discarded. Often, that degree can be a significant amount. Sometimes complexity is unnecessary to convey the idea being presented. Other times, crucial information is lost in translation.
This leads to a simple measure: Simplistic diagrams are limited to simplistic concepts.
Making diagrams that contain more information leads to design issues. How can additional information be presented in a way that doesn't clutter and obfuscate? Our mental models of systems can process and contain a wild amount of information, but they largely consist of abstractions that prove difficult to communicate.
Learning something new requires building new mental models.
We tend to build those mental models using the descriptions, visual aids, and whatever scraps of information we can piece together into a coherent image. However, when the information available is scarce, the visual aids are overly simple, and the descriptions fail to paint a picture, it can be a frustrating experience.
What I'd like to attempt in this bizarre exercise is to present the key concepts that helped me to understand underlying network structures using imagery and visualizations along common themes. If simplistic diagrams are limited to simplistic concepts, that's fine. We can break down complex ideas into simpler ones and visualize them as we go. Keeping consistent themes across the different types of visualizations will help transfer comprehension between concepts. At least, that's my hope.
In basic terms, VLANs (virtual local area networks) are a way to virtualize additional hardware connections with low level software. Creating VLANs is a way to divide the network into virtually isolated segments, and to enable rule based policies to determine how those network segments are allowed to communicate with each other. And it does so using a minimal amount of physical hardware and connections. A simple tag gets added to a packet within the frame that enables network appliances to make determinations about how the packet is handled on both the data link and network layers.
If anything in that explanation strikes you as previously undefined and confusing, don't worry. We'll get into the details of all of it. It's a juggling act to try to explain tech concepts from basic principles because there are inevitable junctions at which many ideas must be introduced concurrently. To some, it might feel unnecessary to explain the basics, while others might feel left behind by glossing over an idea too quickly. I will do my best to present these ideas in a way that's readily accessible for as many backgrounds as I can without using the same dry, rote explanations that experienced technicians are accustomed to. My hope is that providing an unconventional approach to a standard topic will provide something to chew on for all readers alike.
I'm also going to include a quick disclaimer that the point of this exercise isn't to denigrate the value of existing explanations and models, but to try to offer a shift in perspective of how to think about them, and by extension, different considerations for network topology. While I offer my own interpretation of concepts that I feel are usually problematically presented, others might be able to come up with completely novel interpretations. Or they might not agree with the problematic premise to begin with. For all the myriad use cases and all of the different approaches to mapping them, some are going to be objectively good and some aren't. In other words, my offering here isn't of a solution to a problem, but rather an elaboration of my own mental model that helped me to understand certain concepts.
“Begin at the beginning," the King said, very gravely, "and go on till you come to the end: then stop.”
- Lewis Carol, Alice in Wonderland
The biggest stumbling block for me in learning about VLANs wasn't with the basic explanation. I understood the concepts and they're easy to convey. The thought that kept going through my head as I was banging my head against the wall was "what's in the box?" Those little boxes that represent a switch or a router, where lines are drawn to and from that represent connections contained no information about what happens to process those connections. And that's the part that varies heavily between implementations. My SSFBSGLSWT (strange sci-fi Battlestar Galactica lookin' sub-woofer thing) is my attempt to convey the mental model that I developed to facilitate comprehension of those different implementations.
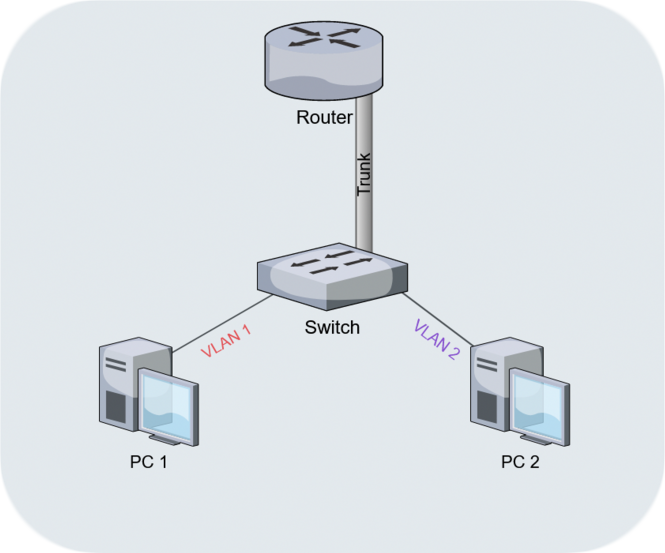
Hopefully it does the job a little better than this.
Kidding aside, this is a useful diagram for describing what's known as a "Router on a Stick" (RoaS), and is almost a useful starting point for describing VLANs in general. But we still need context of what a VLAN is to begin with. So let's talk topology real quick.
Topology is a whole field of study unto itself that has a staggering array of useful applications. A quick look through the introduction of the topic on Wikipedia gives the impression that this is the stuff of Escher-esque brain teasing visual anomalies and maniacal space-time continuum sci-fi shenanigans. It credits Leibniz's Analysis situs and Geometria situs as being foundational works upon which the field of topology was developed.
And as an interesting side note, Leibniz created the stepped reckoner, a prototype mechanical calculator which could perform the four basic arithmetic operations, in the late 17th century. I'm including this little "fun fact" because physical models of abstractions is the ongoing theme here, and the stepped reckoner is a great rabbit hole in that vein.
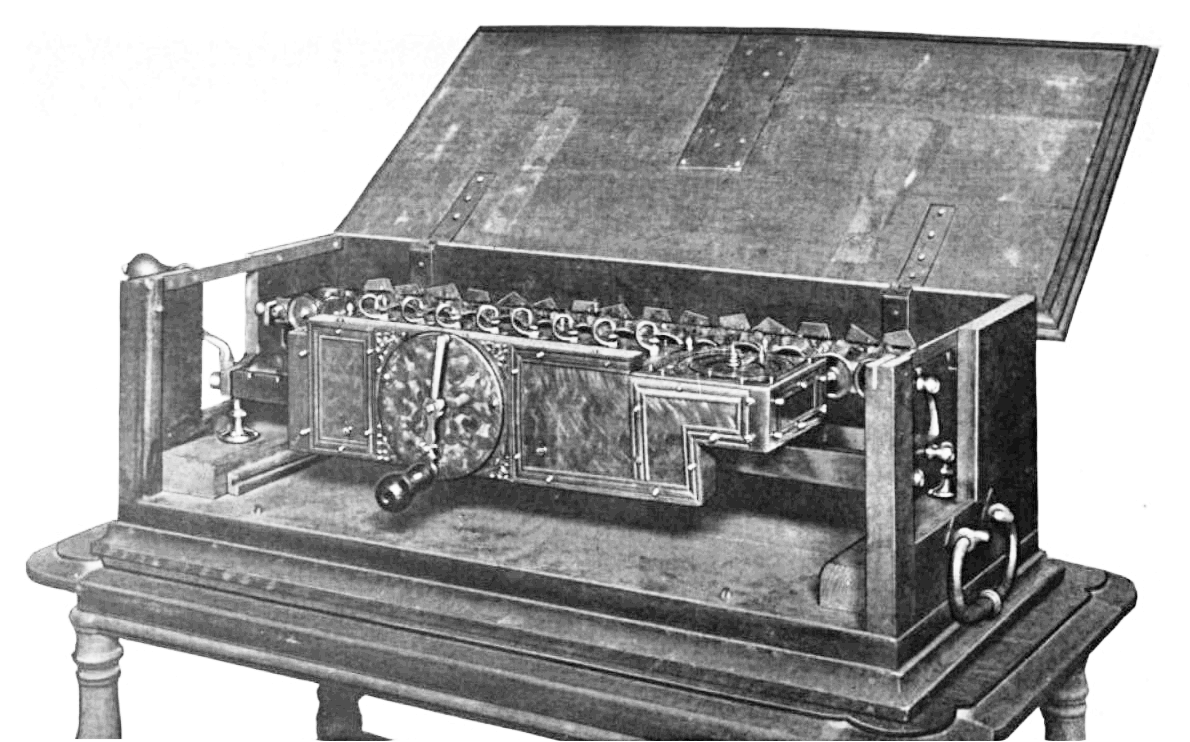
In short, topology is the sort of thing to give you the means and methods to both completely lose yourself and find your way back out. I won't be going into much depth on the subject, but I want to introduce a few key concepts from it because there is relevance in both networking and 3d modeling. "Network topology" is used often and widely in networking to refer to the in situ configuration of devices and connections within a given network. And "mesh topology" is used often and widely in 3d modeling to refer to the in situ geometric features and "flow" of the polygons that compose a given object.
In both cases, the common usage is very informal. Which is to say that the concepts involved don't require getting into much mathematics in order to comprehend. Instead, let's start with an approach of play on words. Since it's informal, let's talk about informing and deforming.
The first thing that might come to your mind with informing is the concept of being informed of something. When informed, you might interpret, incorporate, and integrate the information. These words all share a common etymological root because they all deal with a similar concept of one distinct abstraction absorbing another. Maybe you have imagery floating around in your head now of one amoeba enveloping another to devour it. That is a useful visualization because it describes an envelope, a manifold encompassing another thing, as a boundary that exists between the two things prior to absorption.
This also gives rise to the concept that in order for the two abstractions to merge, there is deformation that occurs. And we can picture it happening both through the process of involution (as the boundary is obliterated and the abstractions intermingle) and within the final product (perhaps even being greater than the sum of its parts) by using that same amoeba imagery floating around in your head.
While envelopment describes closing something off within a boundary, development describes the removal of that boundary and the deployment of the contents.
Visualizing things in this way, we're able to start thinking about abstractions in terms of their manifold boundaries, what features define them, and what deformations are necessary to accommodate additions and subtractions to and from them.
Getting down to brass tacks
or, A Description of Basic Topological Principles Using the Geometry of Pinning a Post-It Note to a Cork Board

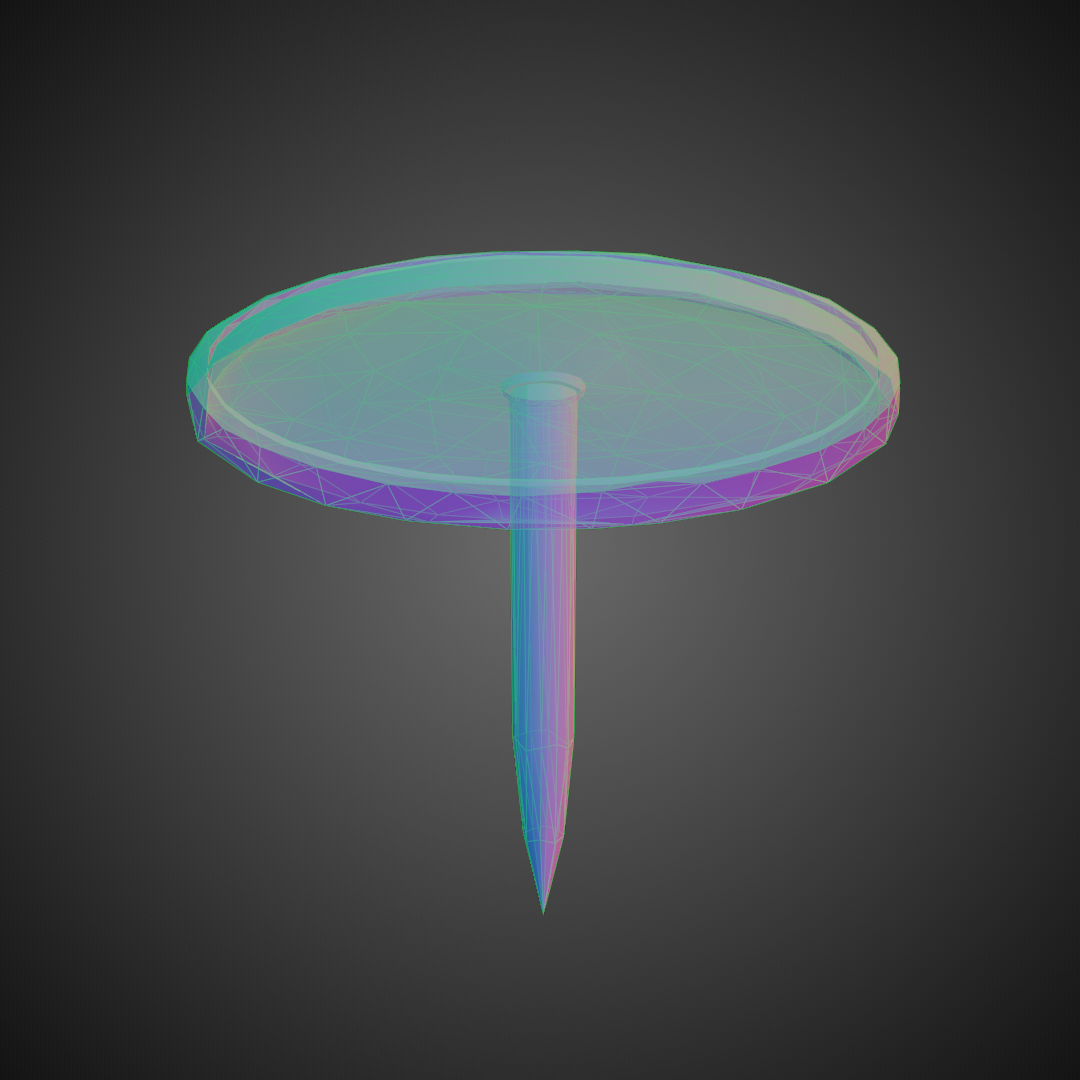
I like visualizations almost as much as I like to mess with idiomatic expressions. We'll be getting back around to applying all of this to VLANs soon, but I just want to put those topological tools to use in something a little less nebulous than amoebas. So let's take a closer look at these so-called "brass tacks" of infamy.
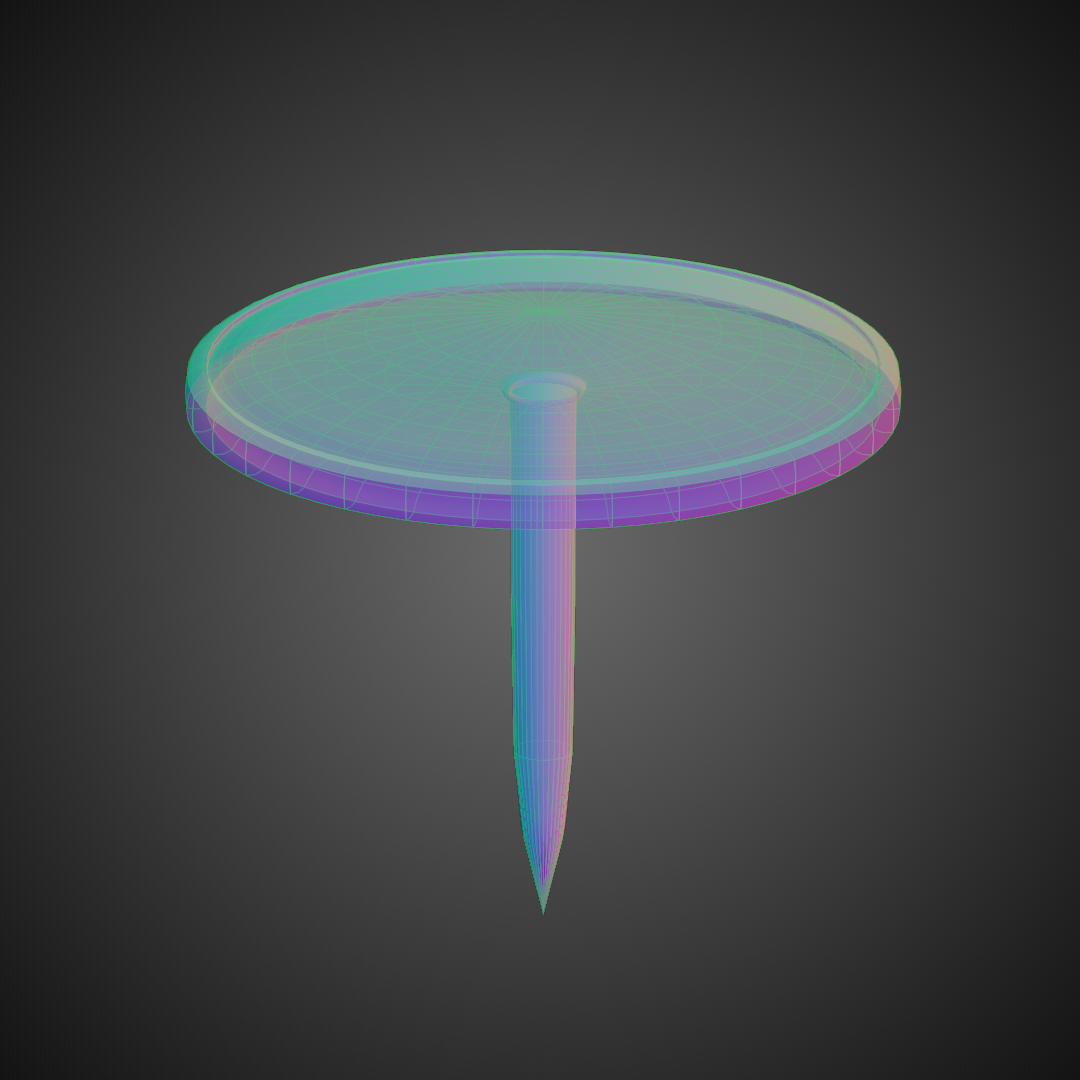
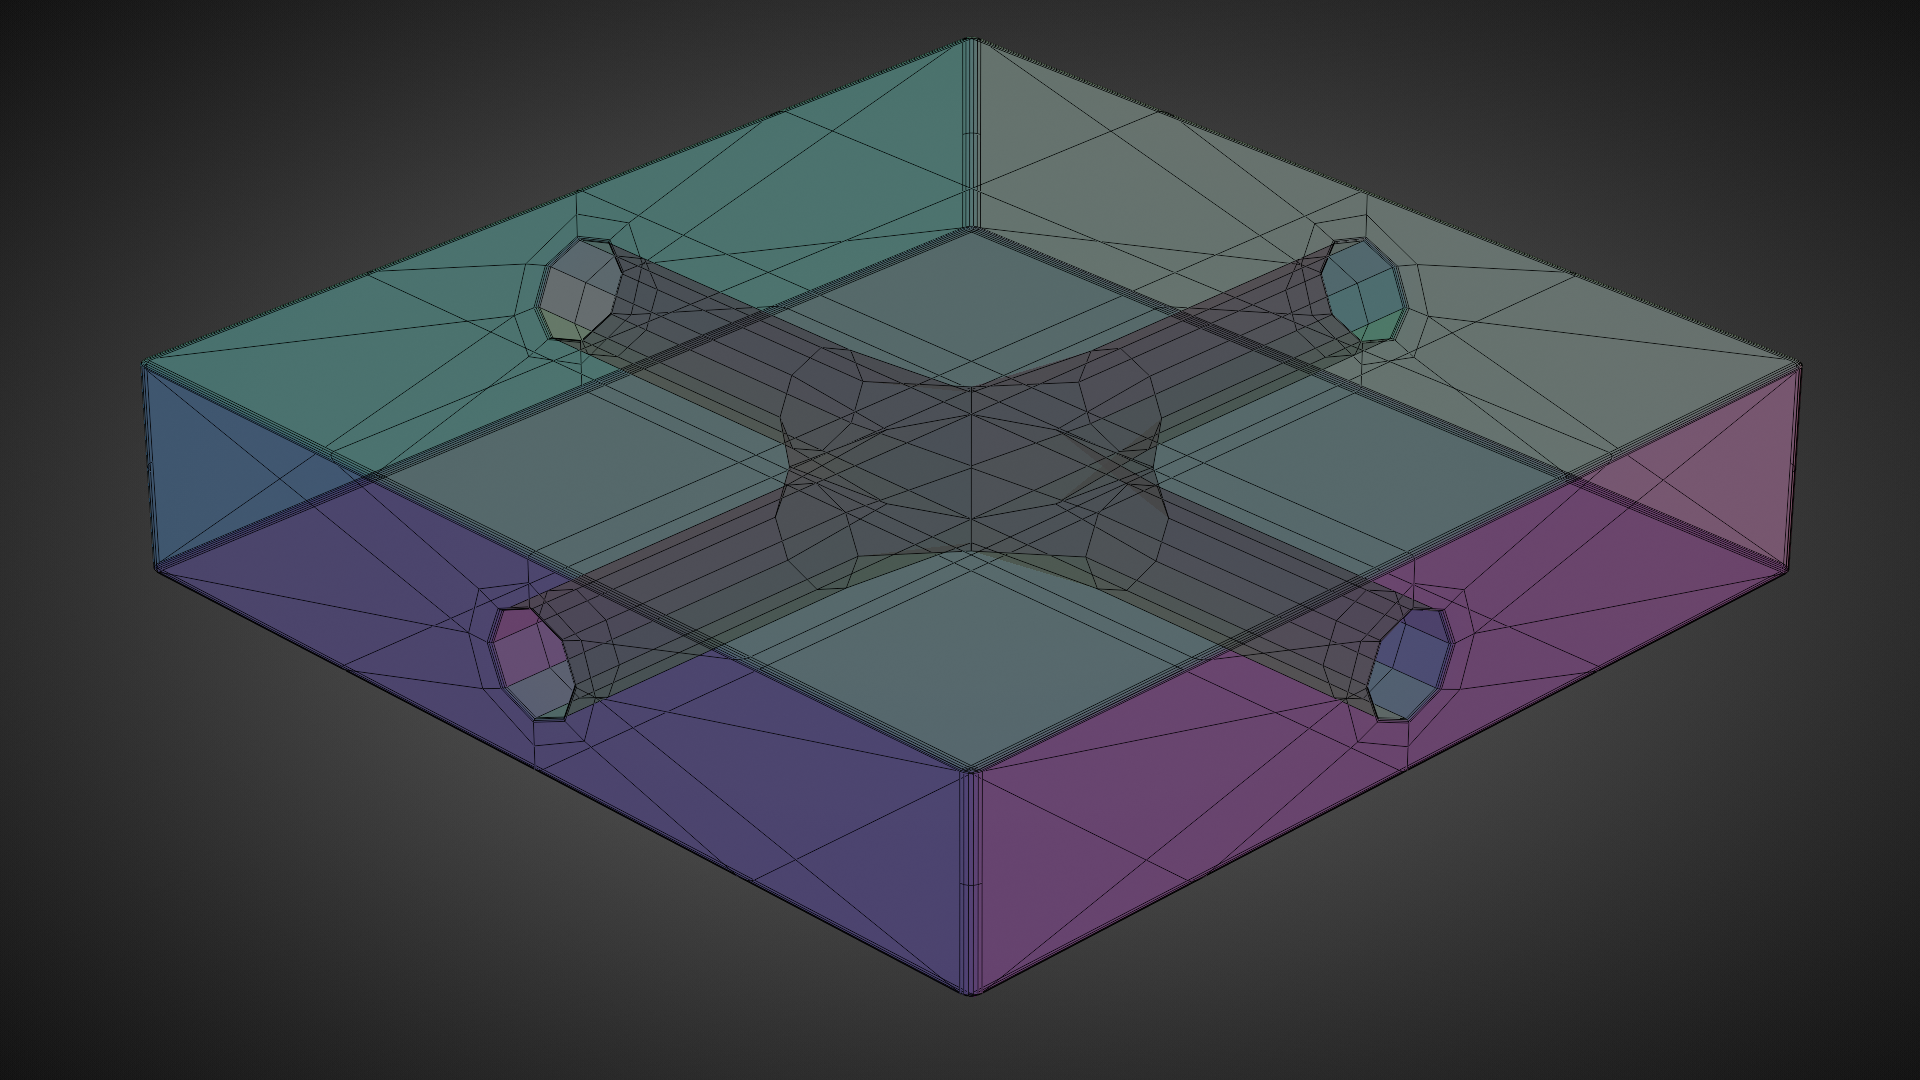
Right off the bat, we can see a few defining features of this tack. Mainly, a domed top with a lip around the edge, and an extrusion from the underside that tapers to a point to form the pin. We can also see the "flow" of the mesh. Because it's largely composed of concentric quadrilaterals, we can follow the order of vertices from one to the next in an orderly fashion along two axes. In turn, this provides the ability to form "loops" that can circumnavigate the object. For instance, the very outer ring can be clearly seen and visually followed. Along the other axis, you can follow a line traced originating from the top of the dome down to the tip of the pin.
The topology of this object is straightforward, easy to read, easy to manipulate, and works well "under the hood" of the rendering engine.
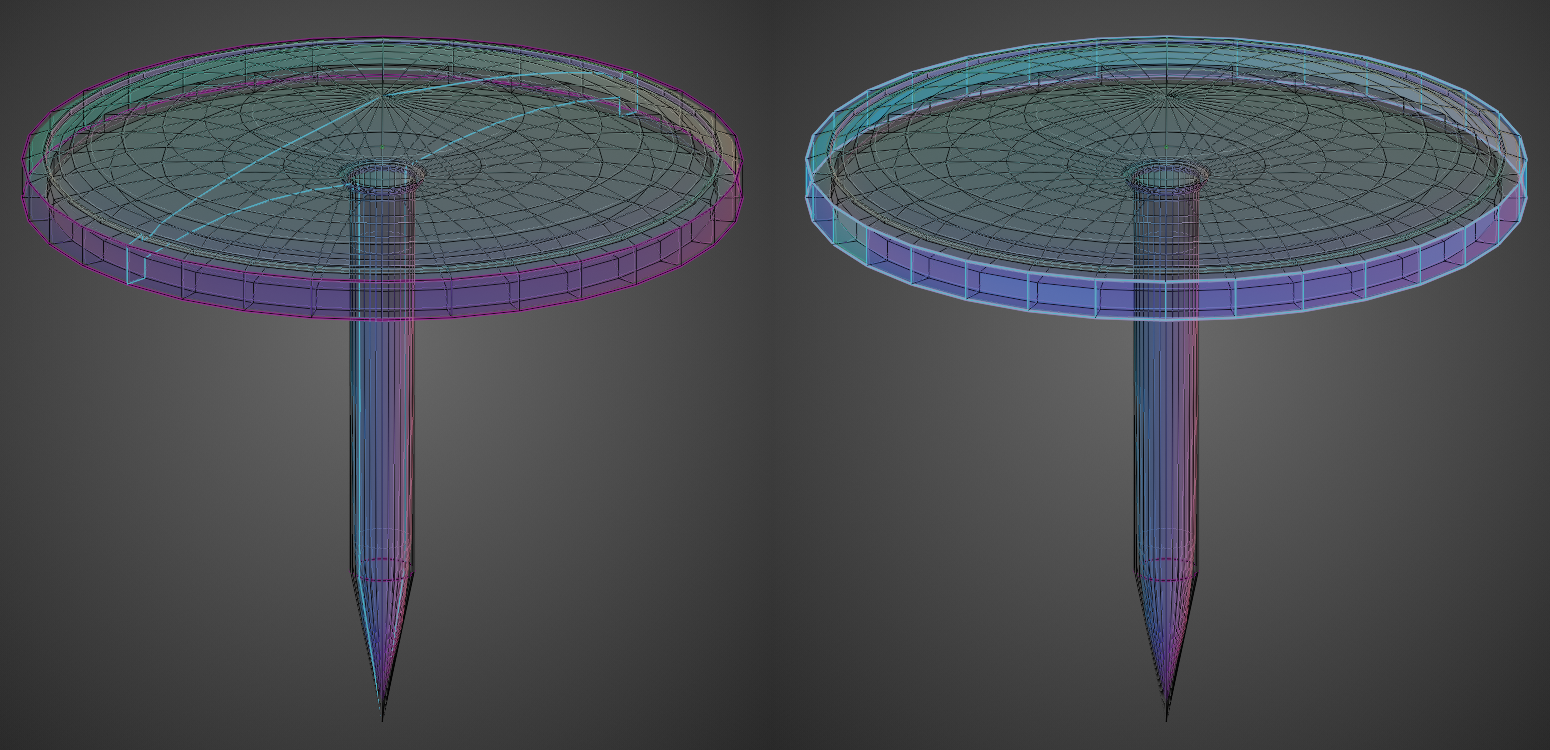
Which leads to the question of what a messy topology might look like.
The object is still basically the same shape, but the mesh topology is now completely different. Orderly topology is starting to look very appealing in comparison.
At the risk of ending up going off into the weeds, this sort of operation, called "decimation", serves a purpose and can be used very effectively to reduce the amount of polygons used to define an object. But this is usually a final step once a mesh is complete, and not something to be done mid-project as it makes modification very difficult. This doesn't have much to do with where we're going and is only included for anyone asking "why on Earth would anyone want to do this?"
Now use this tack to pin a note to the board.
This involves three distinct objects. While the tack doesn't really become altered in this process, the note and the board both go through deformation and have fundamental changes made to them.
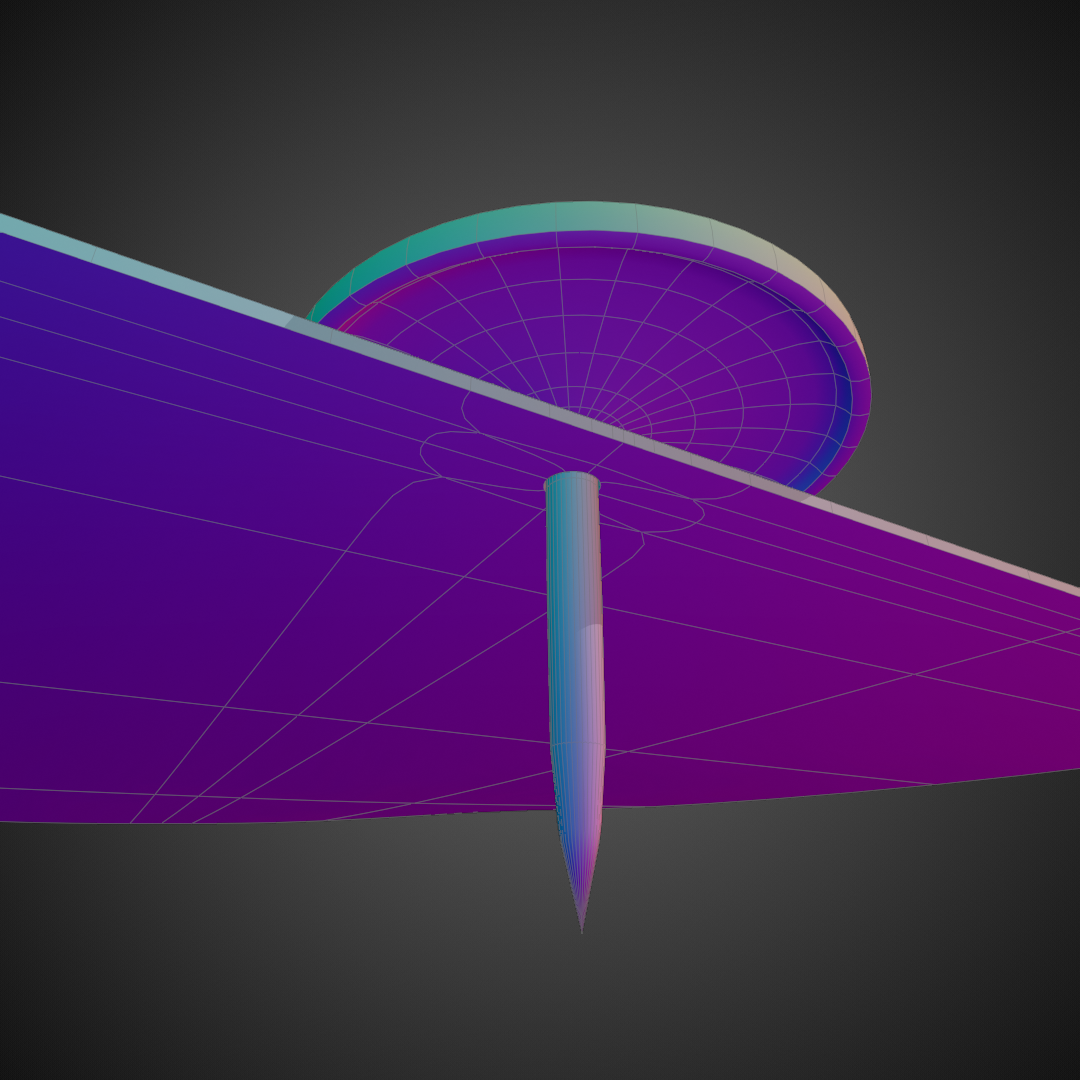
The note now has a hole punctured through its manifold boundary. What started off as basically a squished cube is now more akin to a torus because of that alteration. In order to visualize this, imagine being microscopic and walking along the surface of the piece of paper without the hole. When you get to the edge, you take a step and flip over to the other side. Now with the hole, there is an additional feature where if you step through, you'll flip to the other side. Topologically speaking, this surface now behaves more like a torus than a cube. All because of an alteration that we normally wouldn't even bother thinking about in the course of pinning a note to a board.
Something that's also noteworthy is the addition of geometric features surrounding the hole in order to reinforce and stabilize its local position. Without those added "loops", the alteration would affect a much larger area and potentially distort the curvature or flatness of the surrounding area.
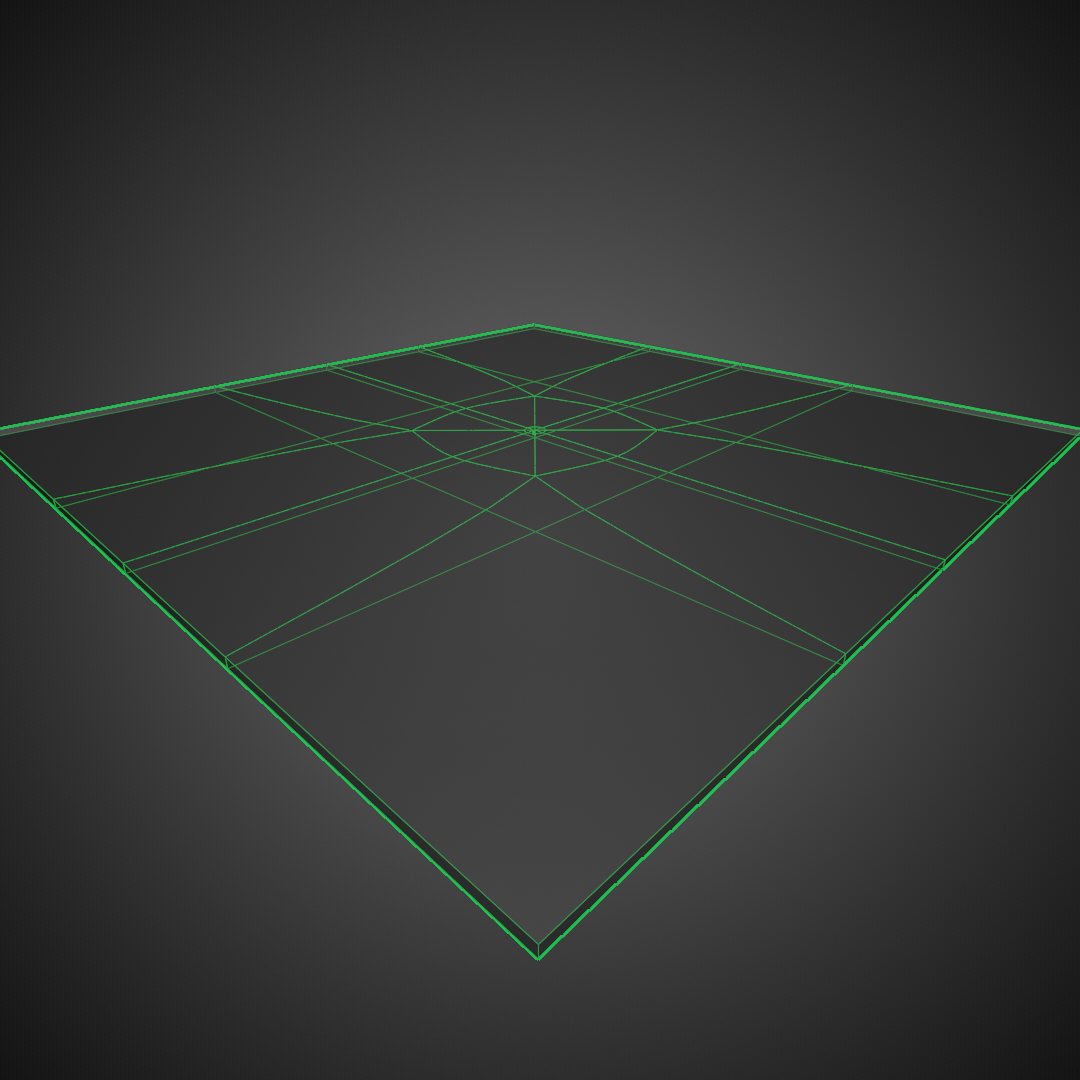
Let's take a look at how the cork board fared its alterations.
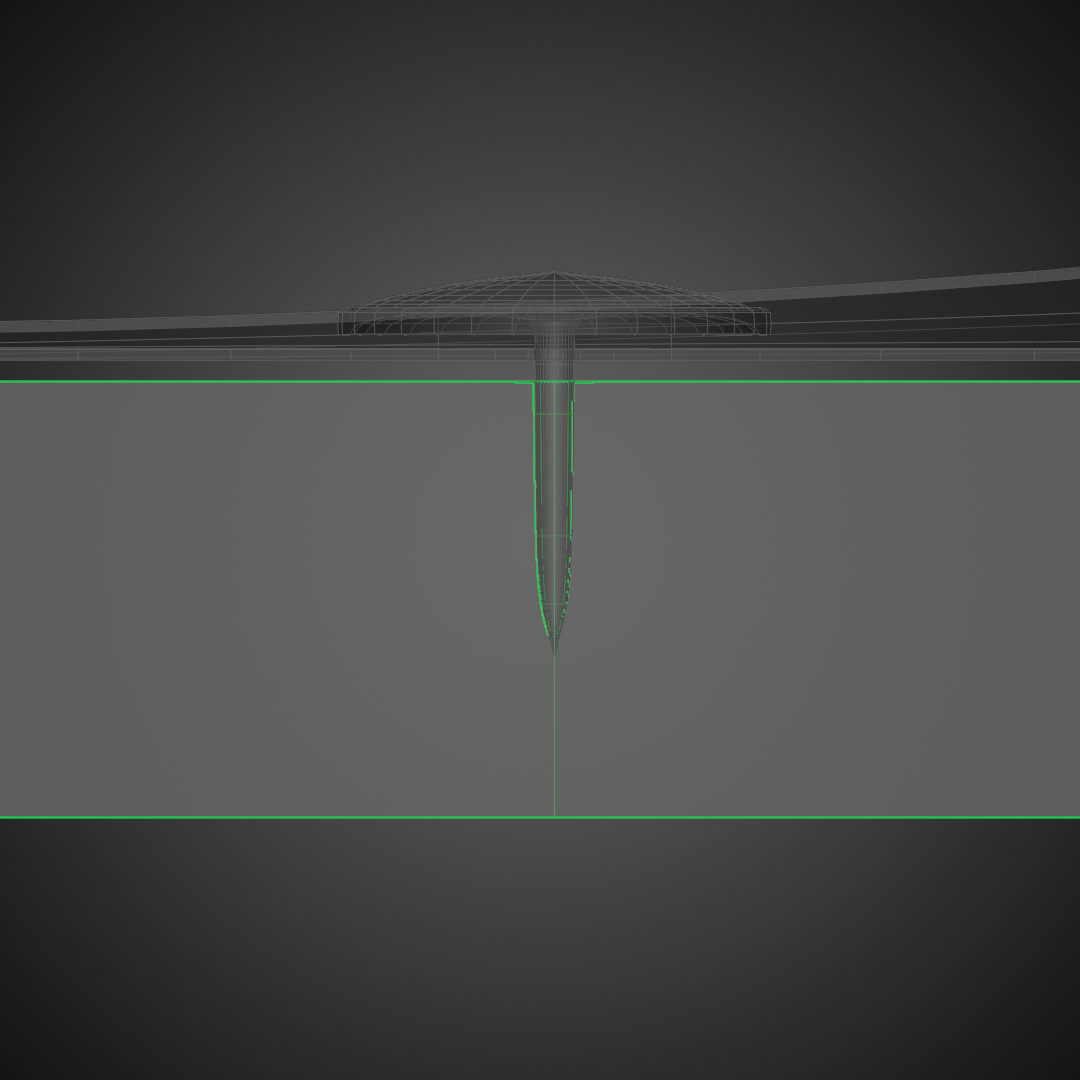
The hole made in the cork board doesn't extend all the way through, so we didn't end up with another torus this time. However, if we zoom way out and take a look at the whole board we'll find that the changes made to the simple squished cube extend all the way around it now. The "loops" required to define the feature add quite a bit of complexity to what was previously a simple geometric primitive.
Let's take a step back now, because it probably feels as if we've gone pretty far off the course of talking about the things that we'd like to understand. Instead, we've been talking about 3d models and idiosyncrasies of wireframe meshes. The important thing to keep in mind is that creating viable models of abstractions can be a bizarre and difficult undertaking, and that concepts can have more portability than what may seem immediately apparent. By that, I mean that lessons learned in one field can often be applied elsewhere if we just find the right perspective to view them from.
So let's talk networks.
Network topology is usually presented using a Visio diagram, or something similar, with maybe a few footnotes to act as mortar. Diagrams can be incredibly useful. But some can be outright baffling.
Also, let's face it: Most network diagrams are hideous to look at. Instead of scouring the interwebs for a suitable example, I've whipped up a homebrew set that suits my own tastes a bit better.
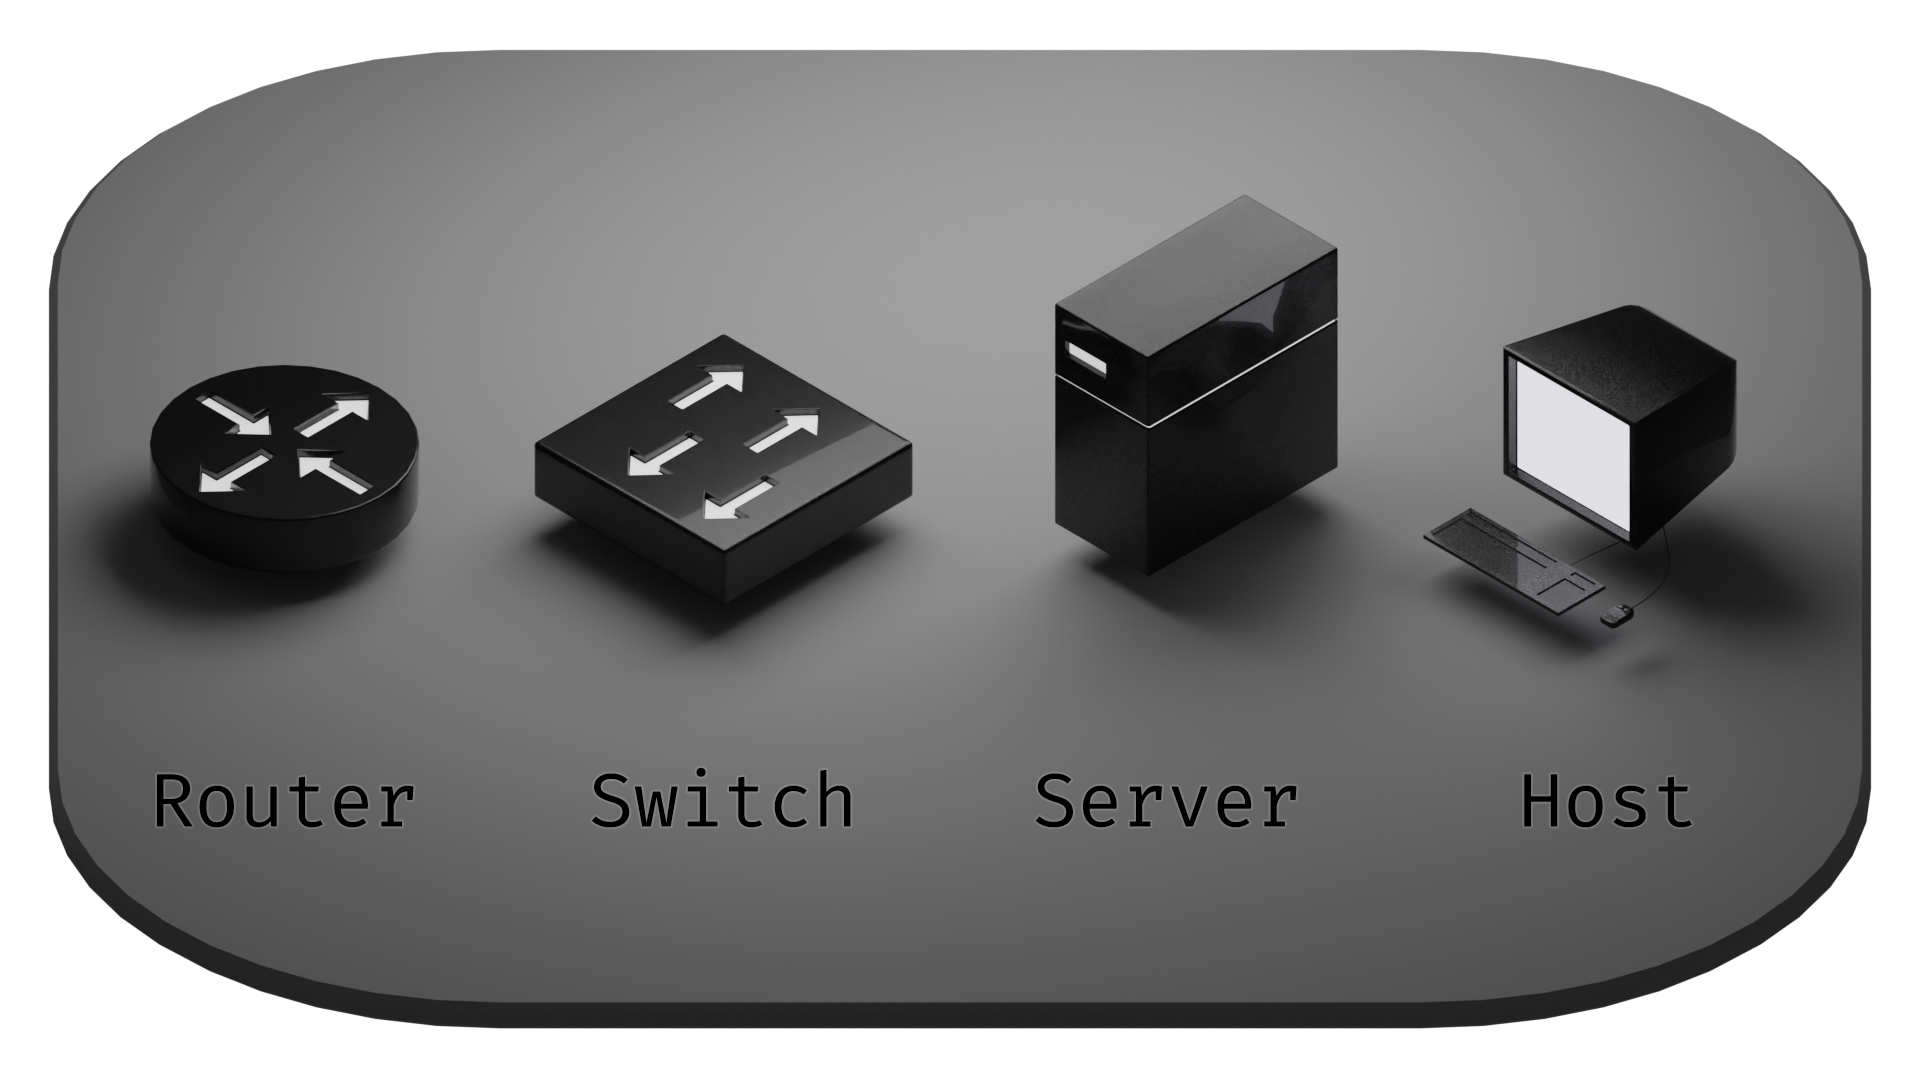
These are the most often seen components in a basic network diagram. There are a range of other symbols to denote other pieces of network appliances and nodes. Network diagrams can have extensive component sets, but this sampling should suffice for our purposes.
Starting with servers and hosts, these are normally simple end points. They share some similarity to the cork board. The additional feature created (the pin hole poked partway into them) is the connection to the network. But generally speaking, these devices don't act as "passthroughs". They generally have a single point of connection through which all communications travel.
Next up are switches. Switches are similarly simple, except instead of a single point of connection, they have many. There isn't a lot of decision-making involved, though. A switch will retain a list of hardware addresses (also referred to as MAC addresses, which is a series of 6 bytes in hexadecimal that looks something like aa:bb:cc:dd:ee:ff) of the devices connected to it, and when it receives a packet with a MAC address it's familiar with, it sends it along to that device.
Topologically, the most complex of this set is the router. That's because routers are capable to varying degrees of defining and directing the flow of traffic. This is in contrast to switches because instead of just keeping track of MAC addresses, they are also capable of defining and keeping track of IP addresses (which is a series of 4 bytes of decimal that looks something like 255.255.255.255).
To visualize how a switch's topology might map out, tack a few pinholes into the switch (no, not literally!) that actually connect through to each other. So you could picture a chamber on the inside that the hole pierce through to.
Say we pipe this form up to a water hose (no, don't connect your actual switch to a water hose!), and turn the water on full blast. It's easy enough to imagine a spray coming out of all the pinholes that aren't hooked up to the hose. Awesome. We have a sprinkler now.
Except this isn't exactly how switches work. For a more realistic interpretation, we should also visualize a set of gates that can control which pinholes are open at what times. Sometimes only a pair of gates are open, sometimes all of them can be open.
However, these extra gates aren't exactly a necessary visualization. For our purposes of defining network topologies, we're most interested in understanding the "broadcast domains" of the network. The times when all the gates are open are for packets being sent to the destination of broadcast domain. In plainer terms, it's possible to address all devices on a local network with this special destination address. In IP addressing, the reserved destination address for broadcast packets is 255.255.255.255, and in MAC addressing is ff:ff:ff:ff:ff:ff.
Broadcast domain transmissions are sent to all devices within the network equally. Since any device can send broadcast domain addressed frames/packets, and a switch will readily allow their transmission, any devices located within the same broadcast domain should be considered part of the same flat network.
For routers, we're not going to be able to make such a simple model.
While superficially they serve a very similar function to switches, concatenating multiple connections into a single upstream connection as well as passing local traffic to the appropriate destination, they are generally capable of performing many more functions. Those capabilities can be utilized on as as-needed basis. In certain situations they might be employed to function more or less the same duties as a switch, while in other situations they might be needed to host a significant array of services that add complexities to the network topology beyond what can be represented with a simple intersection of tubes.
This leads to black box scenarios where footnotes are needed for elaboration upon the details of the services present that may affect topology. And in a lot of network diagrams those footnotes are simply absent, leaving the interpreter guessing which of the myriad scenarios apply. So while network diagrams can be very effective and succinct at conveying network structure, organization, wiring configurations, and addressing schemata, they can easily fall short of the mark of truly conveying network topology to succinctly convey the configuration states of the devices.
Since routers are much more context dependent, let's look at some contexts, starting with a simple "flat" network.
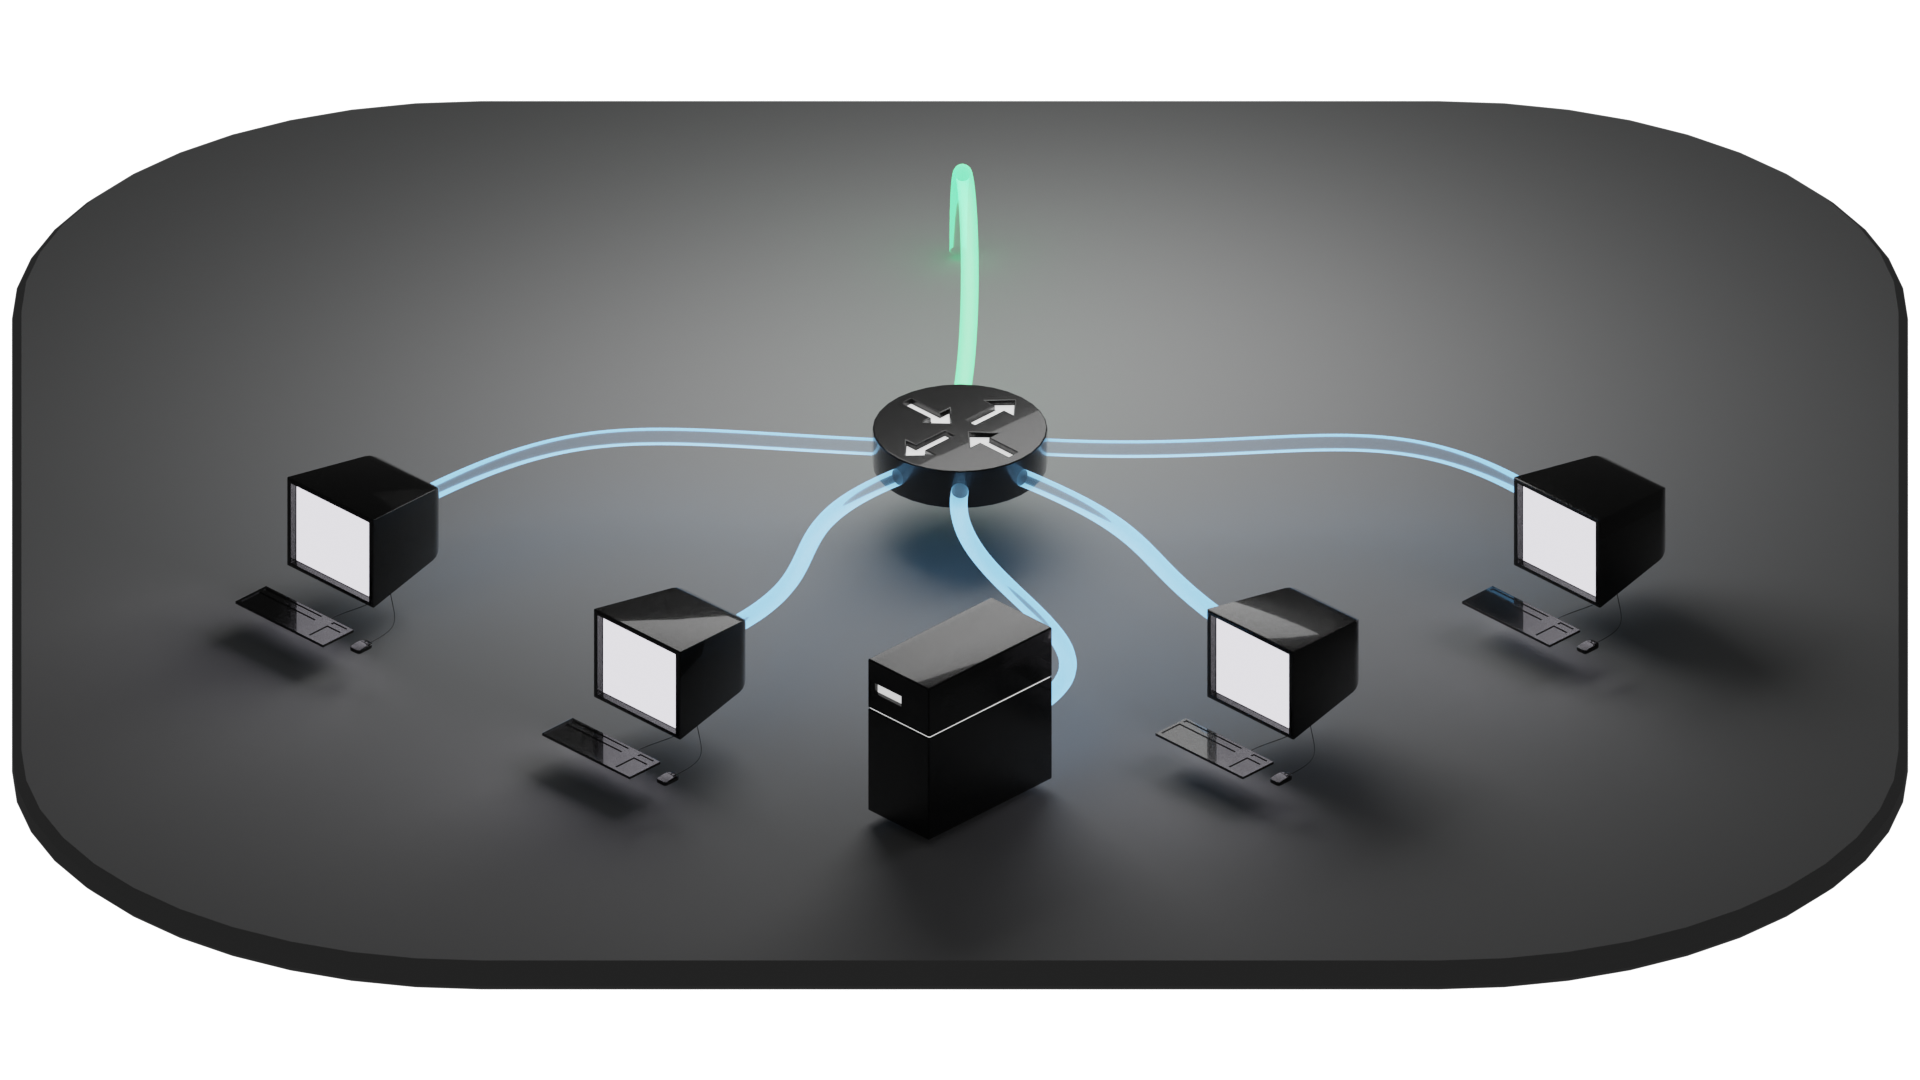
Adding some mortar to the brick to make it stick and giving some quick footnotes is pretty easy with this one. The devices connected to the router are all on the same local network. Let's call it a 192.168.0.0/24 network.
The /24 is a CIDR (Classless Inter-Domain Routing) designation used to simplify addressing schemata that means, in this context, that the devices will be assigned local IP addresses ranging from 192.168.0.1 - 192.168.0.254. The addresses are assigned by the router itself with a DHCP server. A DHCP server is a decent example of one of the services that routers can perform that switches generally do not.
What's most important to our ability to define the topology is the knowledge that all of the devices are located within the same broadcast domain. Unless the router's firewall (another relevant service) has rules to specifically prohibit certain connections, each of these devices should be capable of finding and communicating with each other.
Also of note is that I used a different color to delineate the local network downstream from the router from the upstream connection. This may seem like an unnecessary distinction now, but it will become more relevant as we add more complexity into our examples.
Already, our flat network is getting difficult to read, topologically speaking. If not for the fact that all of the local connections are labelled blue, we'd be left wondering what the specific configuration of that second router might look like. Is it masquerading the devices behind it, performing NAT, and defining a different subnet? In this case, no. We still have a flat network. All of these devices are still on the same local network, and are all capable of discovering and communicating with one another.
Maybe the router is performing another service. Maybe it was included simply because it has the potential to perform another service. For whatever reason, the person who made the diagram (hey now, don't look at me like that!) decided to label the device in that location as a router even though topologically it's performing the same function as a switch. The intention underlying the formulation of the diagram may be obvious to the creator of it, but can easily lead to unintended ambiguity for the readers.
What would a network look like that isn't flat? For that, we're going to go back to our simple flat network and reconfigure the router to serve some different subnets.
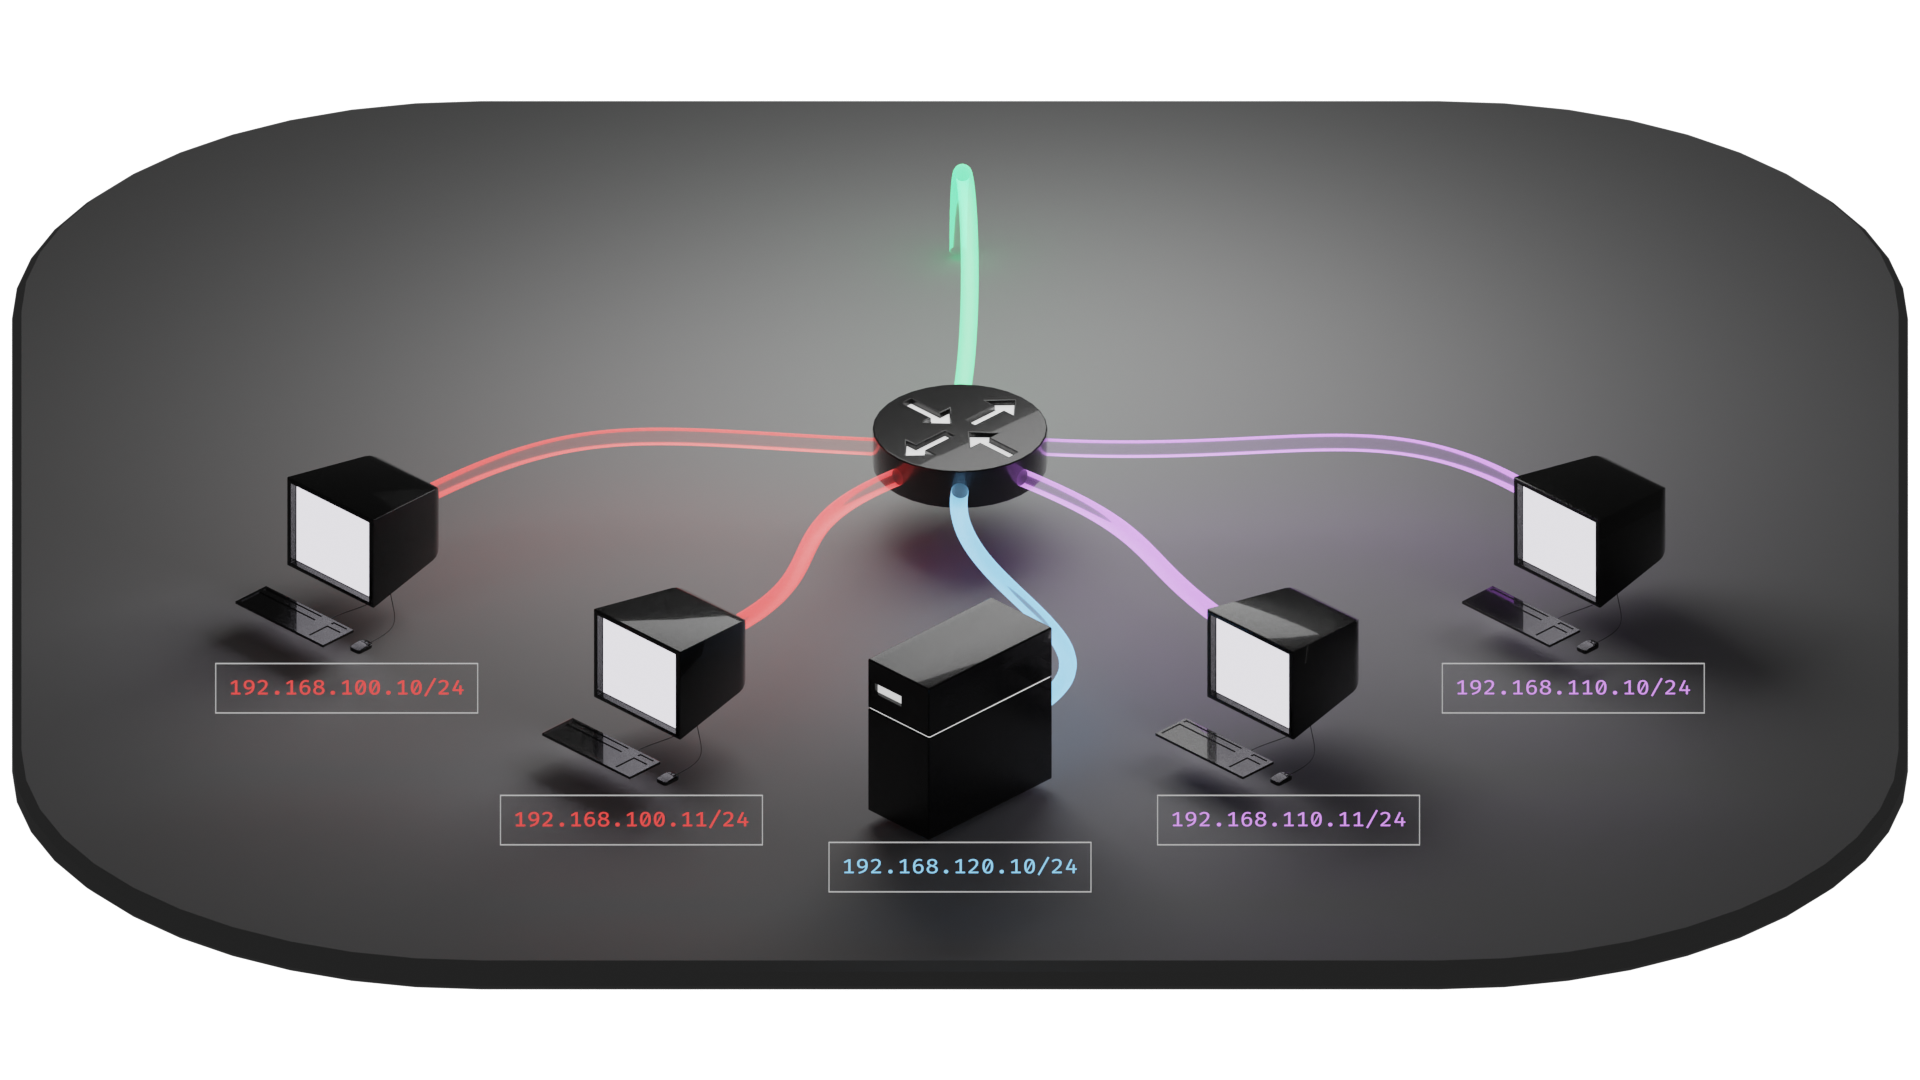
Subnetting is a way to isolate networks from each other by defining different IP address ranges. This limits the scope of the broadcast domains for each subnet. It's then up to the router whether to allow or deny traffic between them.
In our example above, our subnets are delineated across the third octet. The red network uses 100, purple uses 110, and blue uses 120. Depending on the configuration of the router these devices might be able to talk to each other or not. For example, we might want the blue network to be able to provide services to both the red and purple networks, but not talk beyond the router to the green network. And we might also want to keep the red and purple networks from talking to each other at all, but to be be able to access the blue network and break out to the internet on the green connection.
Unfortunately, this diagram doesn't tell us much about the internal state of the router. We can determine that it's providing three different subnets, but we can't tell how those subnets mesh with each other.
Let's take this a step further and get a little wacky with this.
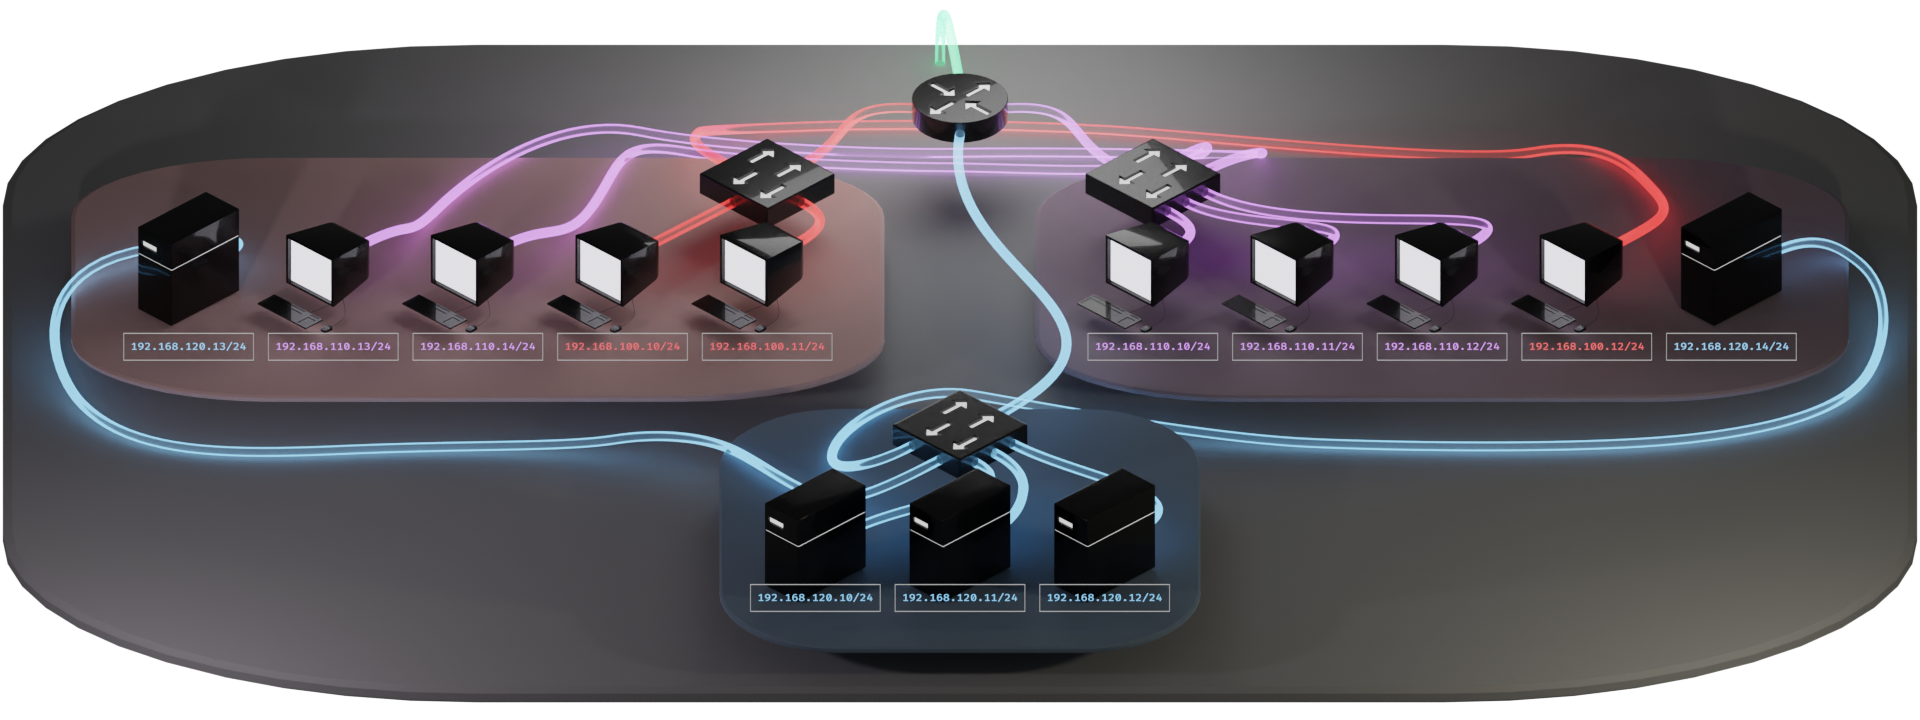
We've got some devices grouped by physical proximity. And we have connections labelled according to subnet. The thing is though, we have some mixed and matched associations going on. The blue section is nice and straightforward, but the other two have devices connecting to each different subnet as needed. So in this case, we have to run those connections back to the appropriate switches that serve a given subnet. Another option might be to have a multitude of switches for each location. This might be a preferable approach if we have much more devices.
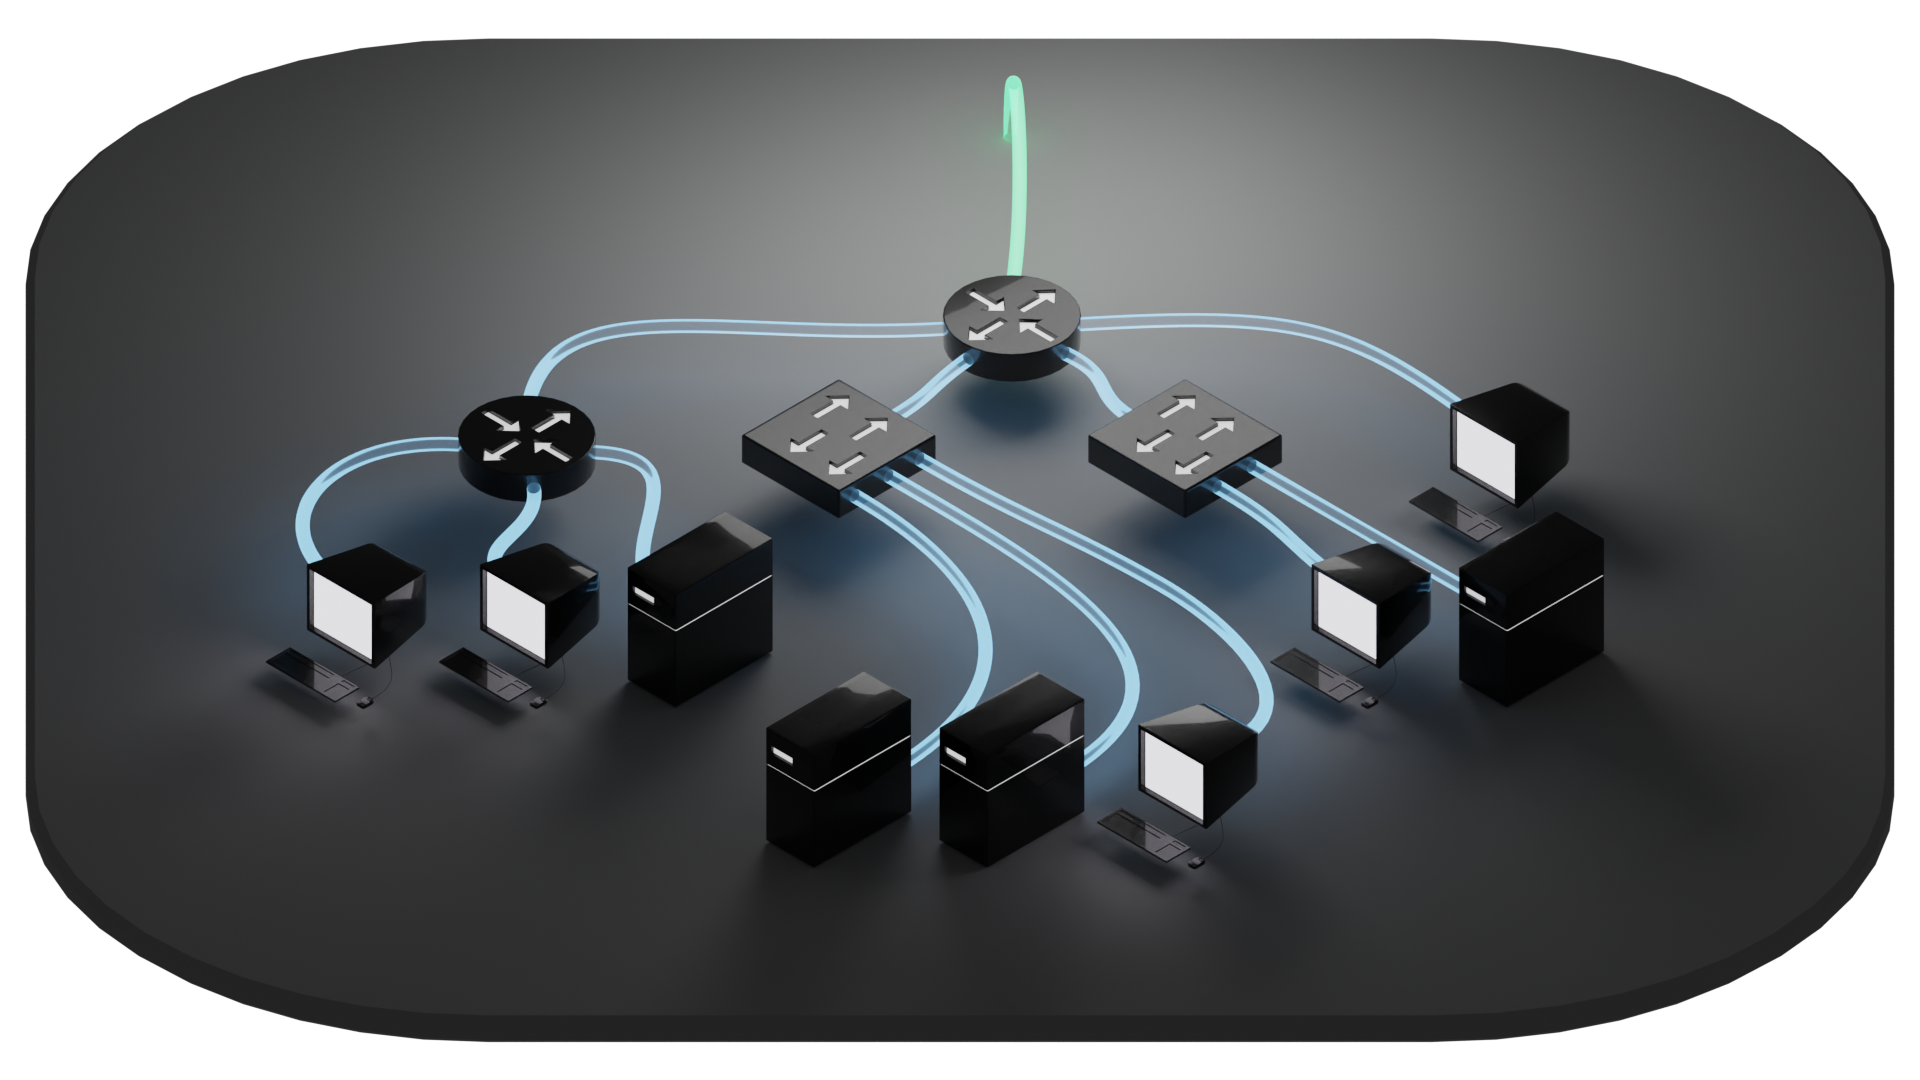
This is where VLANs come in handy. Remember that first diagram we briefly looked at of a Router on a Stick? Let's apply that to this scenario.
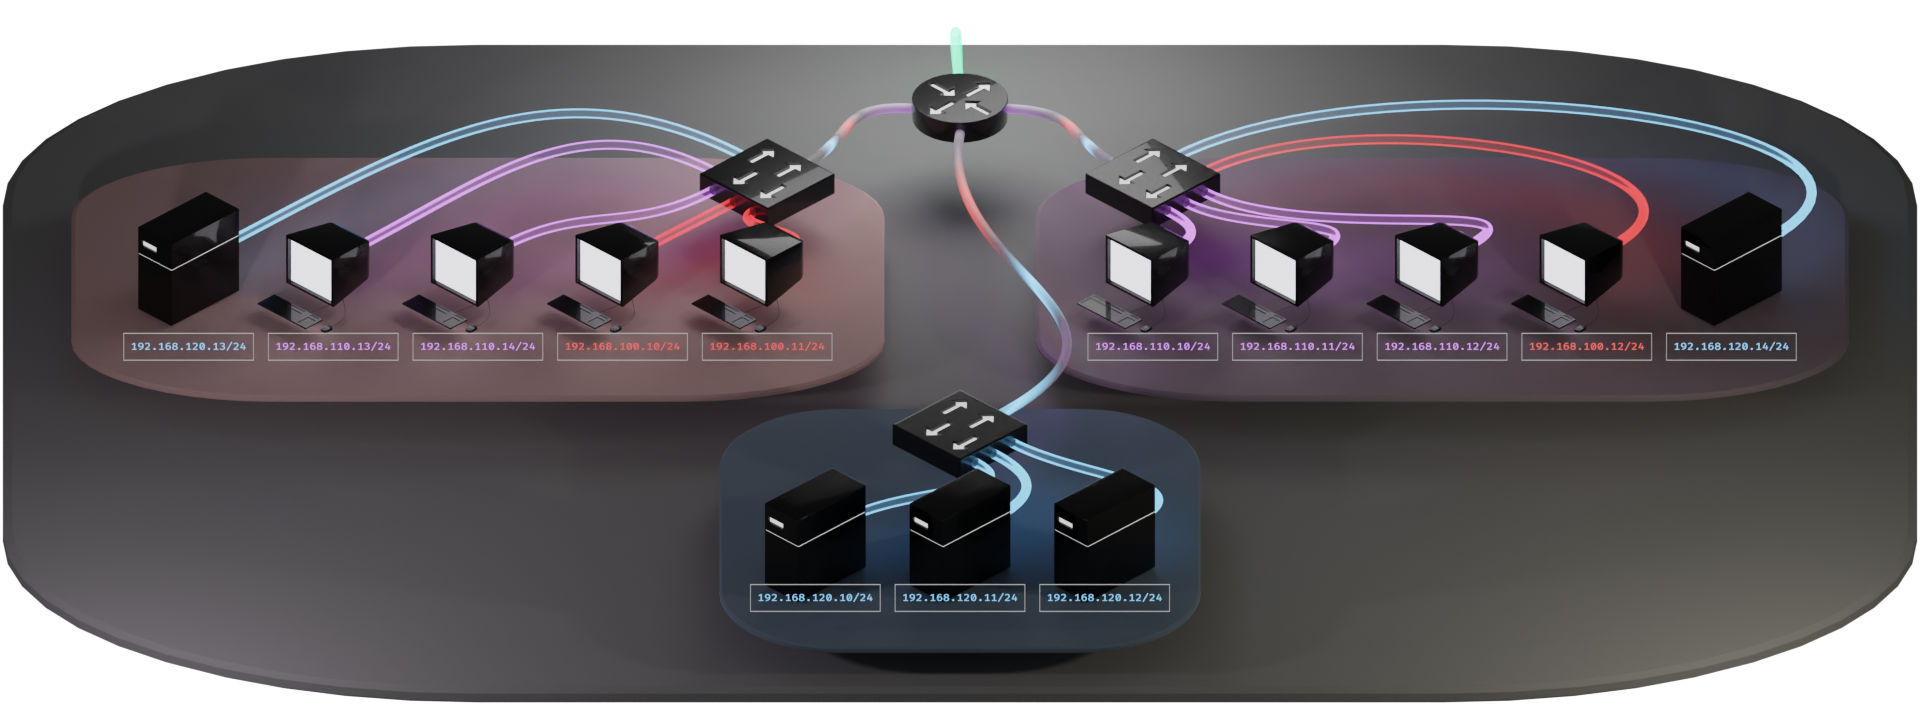
This cleans things up quite a bit. Now we have localized wiring within each group while maintaining access to the variety of subnets. We have a hierarchy that is much easier to visually follow.
This also changes things up quite a bit. Now we have switches with different subnets being served from them, as opposed to routers as we'd expect to see performing such a function. We also have strange rainbow colored connections between the switches and the router.
The thing that makes this all possible is the VLAN tag. This is a simple little mayfly of a sequence of 2 bytes tacked on ephemerally by routers and switches. This tag lets the other routers and switches know which VLAN the traffic is intended for. The tag only stays in place within our local network between the switches and the router. The presence of these tags create what are called "trunk lines." On our diagram, the trunk lines are indicated with the rainbow colored connections.
The tags don't make it all the way to the host machines on the network. Nor do they leave to journey out into the wilds of the interwebs. These mayflies are created and removed by the switches and router, and never venture further than the trunk lines. Their lifespan is not much longer than a handful of milliseconds. Their sole purpose is to pass the VLAN information from one network device to the next.
So VLAN tags give us the ability to create trunk lines, and trunk lines allow us to drive multiple subnets through a single connection. This opens the door on a lot of possibilities that, while they may not have been previously impossible, would have been difficult or costly to implement.
Oh hey, you're still here!
That'll just about wrap up this section, but while we may now know what VLANs are, we still haven't gotten into how to fit these pieces together topologically. There is still plenty more ground to cover, so I've decided to split this up into more manageable pieces before it gets away from me entirely.
The goal of Part 2 is to provide an explanation of the concepts of TCP/IP and OSI layers, frames, packets, and the distinction of physical and logical models. If any of these concepts are completely unfamiliar to you, it might be worth giving it a perusal before we dive into more details about VLANs. It uses the topological concepts we explored earlier to establish a visual model that integrates nicely into all this VLAN stuff.
Nad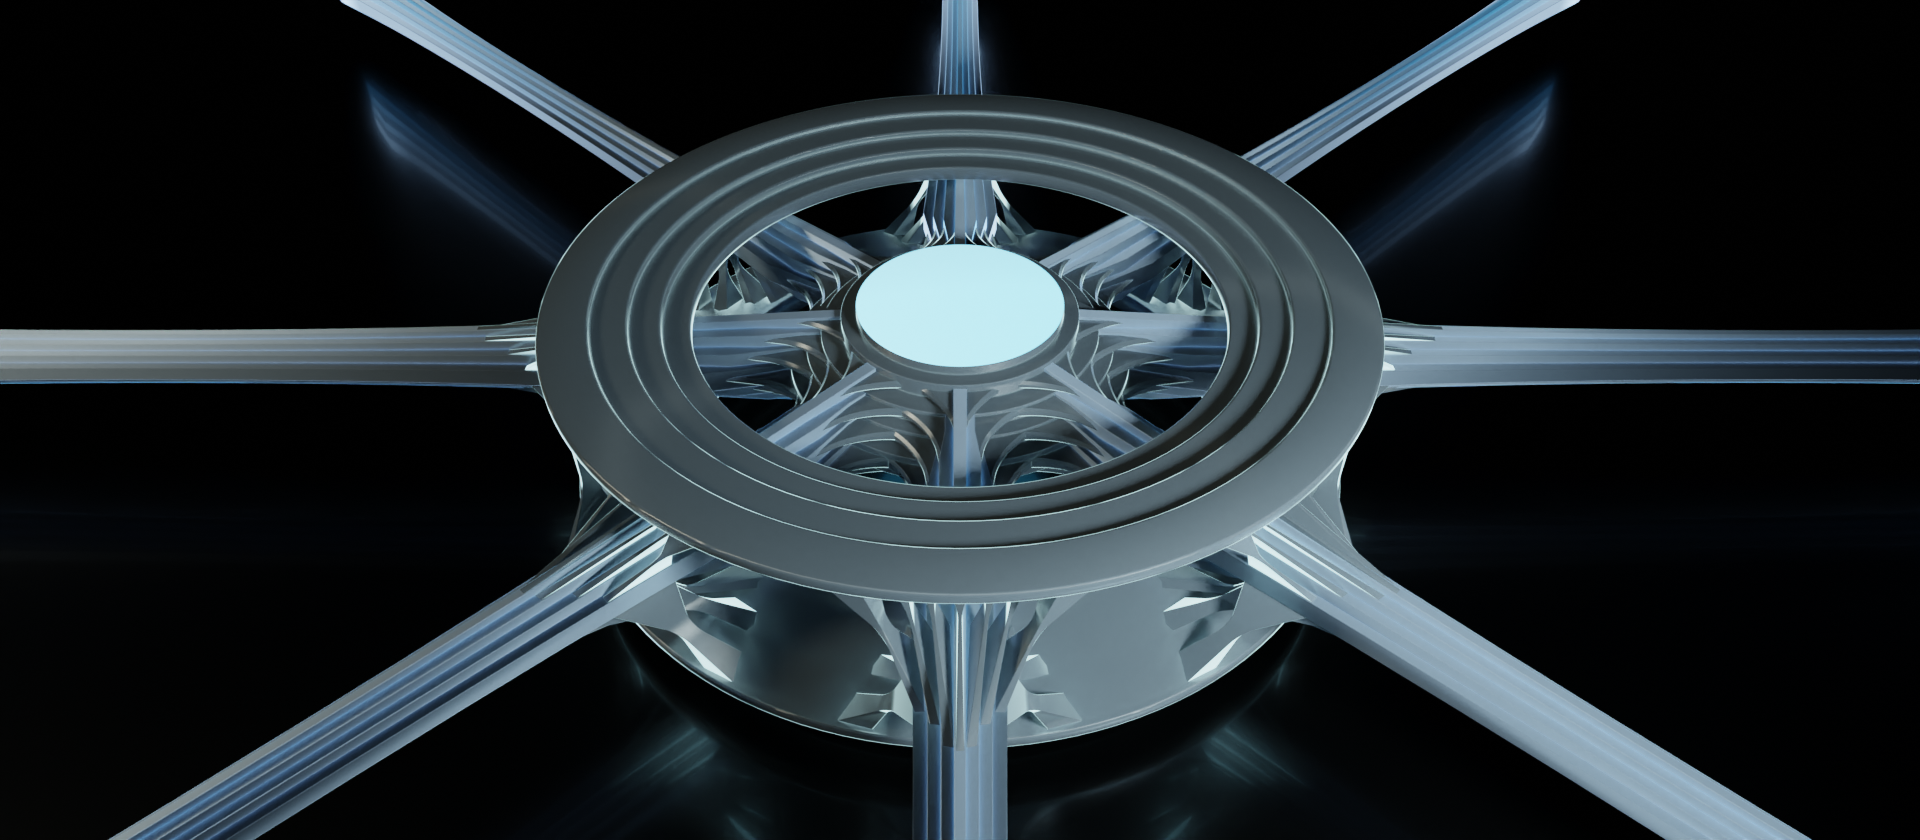
Part 3 will put a bow on this whole eccentric array of exposition by bringing in the Battlestar Galactica Subwoofer once more to tie it all together.
If you have any suggestions or corrections for me to take into account, please let me know! I tried to make this as orderly as I could, but whether you're an experienced technical engineer, just starting out, or simply reading through out of curiosity, if you feel that there are any sections that need improvement I'd appreciate the feedback.